Understanding SUM and SUMX in DAX for Power BI
Power BI users frequently need to perform aggregations, and two popular functions for summation in DAX are SUM and SUMX. Although they appear similar, they have different uses based on the situation. In this blog, we’ll look at the differences between SUM and SUMX with practical examples.
What is the SUM Function in DAX?
The SUM function is an easy way to add all the values in a column.
Syntax:
SUM(<column>)Example:
Consider a sales table with the following structure:
| Product | SalesAmount |
|---|---|
| A | 100 |
| B | 200 |
| C | 150 |
To calculate the total sales, use:
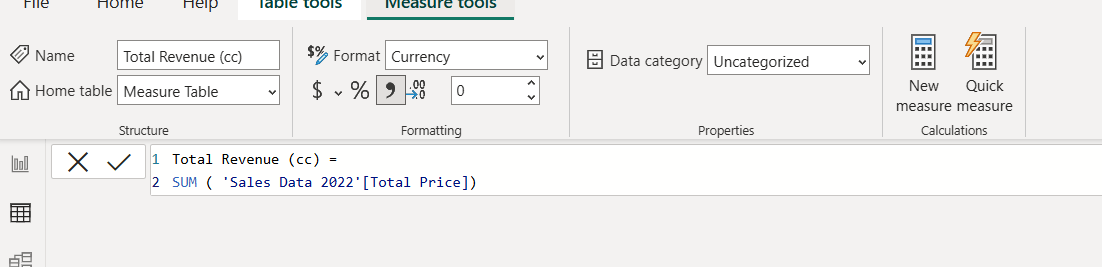
Total Sales = SUM(Sales[SalesAmount])This will return 100 + 200 + 150 = 450.
Create Sum Measure as:
What is the SUMX Function in DAX?
The SUMX function is an iterator function that evaluates an expression row by row and then sums the results.
Syntax:
SUMX(<table>, <expression>)Example:
Consider a sales table with additional quantity and price columns:
| Product | Quantity | Price |
| A | 2 | 50 |
| B | 3 | 80 |
| C | 5 | 30 |
If you need to calculate the total revenue (Quantity * Price), using SUM won’t work because it operates on a single column. Instead, use SUMX:
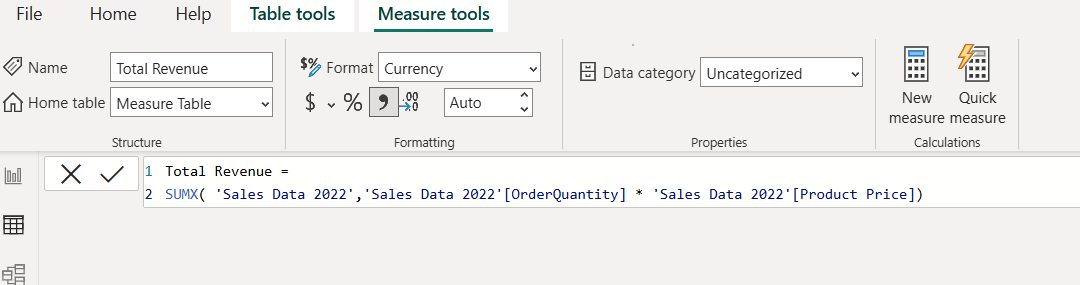
Total Revenue = SUMX(Sales, Sales[Quantity] * Sales[Price])This will calculate:
- (2 * 50) + (3 * 80) + (5 * 30) =
100 + 240 + 150 = 490
Create sumx measure as
Key Differences Between SUM and SUMX
| Feature | SUM | SUMX |
| Works on | A single column | An expression across multiple columns |
| Iteration | No iteration | Iterates row by row |
| Use case | Simple aggregations | Calculated aggregations (multiplication, conditional sums, etc.) |
When to Use SUM vs. SUMX
- Use
SUMwhen you simply need to aggregate a column of numbers. - Use
SUMXwhen calculations are needed on multiple columns before summation.