Include and Exclude in the Microsoft Power BI graph chart
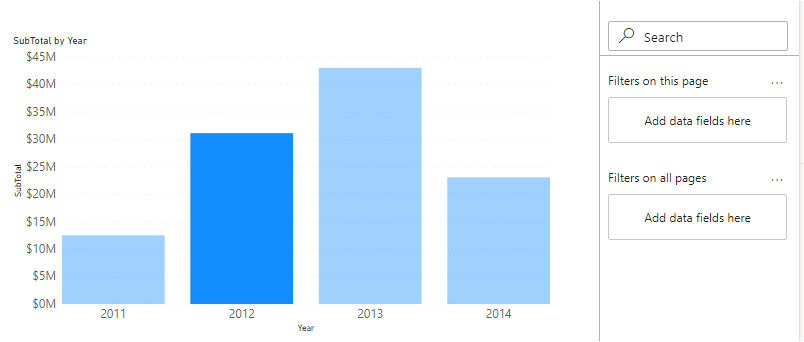
We have a bar chart that shows the sales data year wise as shown below:
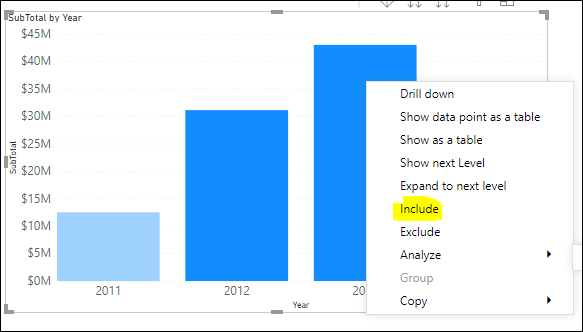
In this chart we only want to compare two years, for that we use INCLUDE or EXCLUDE functionality by pressing the ctrl key on the keyboard, We select the 2012 and 2013 years. Right-click on the chart which shows both the include and exclude options.
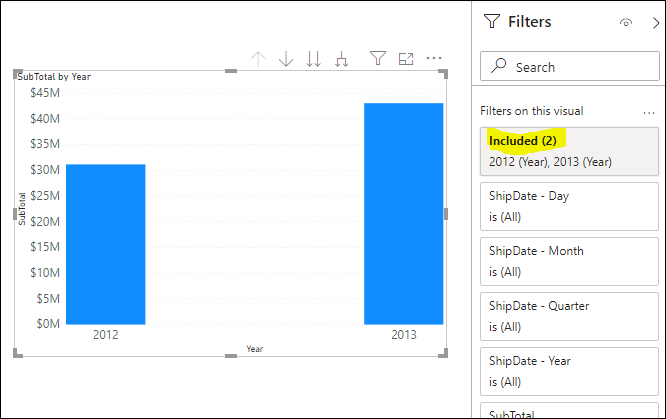
Select Include option will keep only the 2012 and 2013 year bar graphs as shown below. In the Filters tab, we see one include filter is added. So we can filter or compare bar charts by using the include and exclude features in Power BI.
Remove this include, Go to the Filter tab and click on x.
Similar way, we can exclude the bar chart by selecting with the Control key and bar chart.