Get the particular data from Graph in Microsoft Power BI
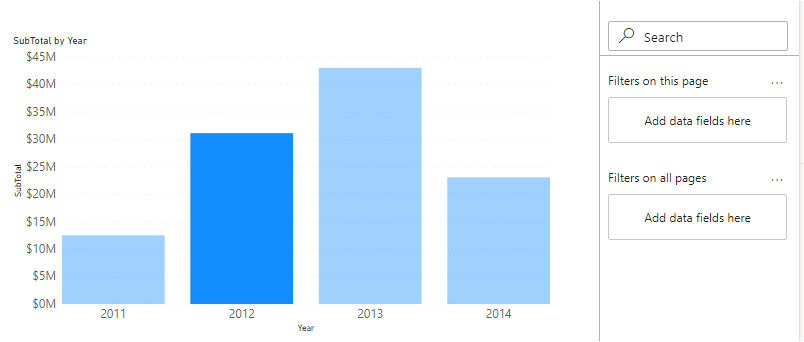
We have created a bar graph that shows us sales data yearly as shown below:
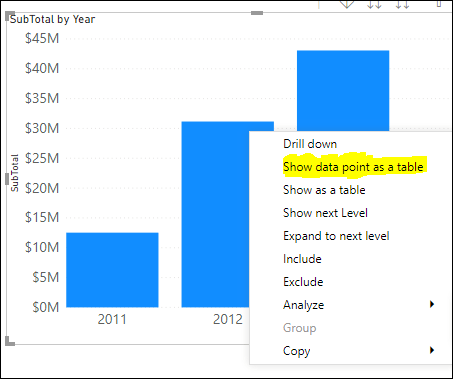
Do we need to check which data is involved in 2012 or do we need to filter out the data from the database or Excel sheet for 2012 data? We will use select queries or filters to get this data in the traditional way but you can also filter data in PowerBI with Show Data Point as a table. We simply right-click on the 2012 bar chart and select Show data point as a table.
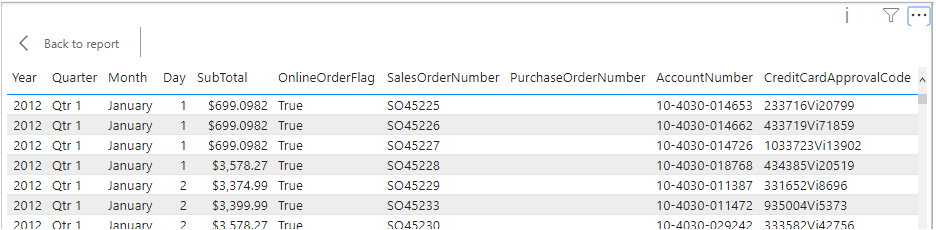
It shows the 2012 data in excel format. You can get this data by clicking on the right side 3 dots … and saving data in CSV format.