Check procedure and Queries in SQL Profiler for MSSQL Server
- Open the SQL Server Profiler direct OR Open from SQL Management Studio —> Go to tool –> Select SQL Server Profiler.
- Connect with the Server on which you want to connect for tracing with Servername, username and password.
- Open a Trace Properties window –> General tab, for Use the template field select Standard.( Default)
- Check on the file or table option on which your data saved as trace. I click on Save to file option and choose the location from browser button as shown below:

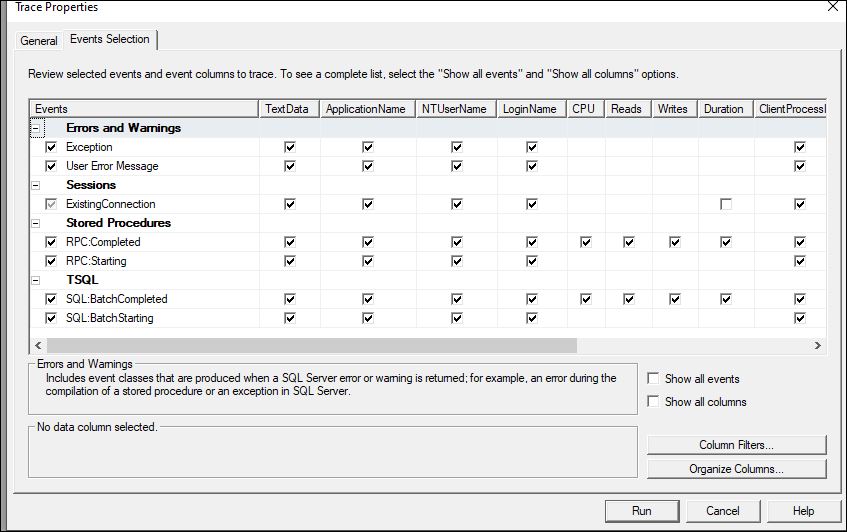
5. Go to the Events Selections tab. Check on Show all Events.

6. Expand the Errors and Warnings event category and select : Exception and User Error Message.
- Choose trace for Procedures and TSQL queries:
Expand Stored Procedures event category and select: RPC: Starting and RPC: Completed
Expand TSQL event Category and select: SQL: BatchStarting and SQL BatchCompleted.
8. After Selection, you will see like following:
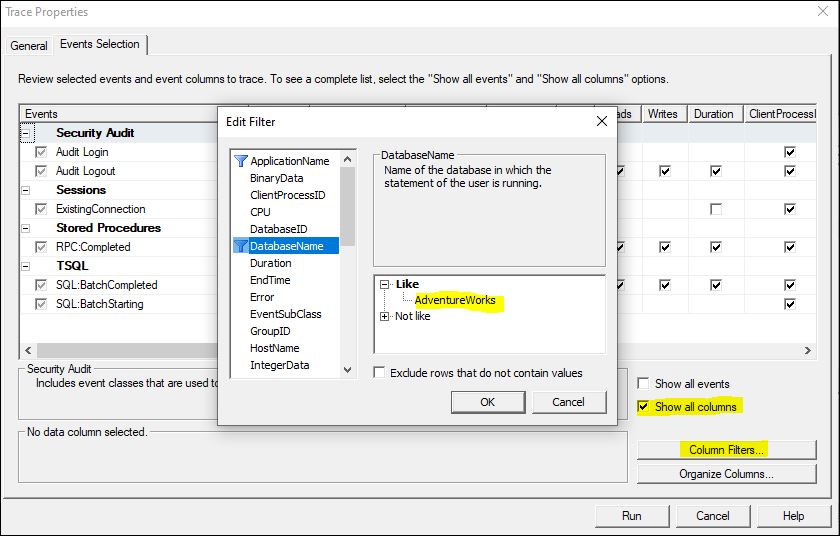
9. If you filter out for any specific database then click on Show all Columns.
Go to Columns Filter –> Choose Database Name as show below:
10. Run the SQL trace for tracing the Errors